svg adventures (and earthquakes)
Well, that was thoroughly frustrating. I wanted to render an SVG file to a PNG file (I'll get to why in a moment). So I did a quick search and found librsvg that includes a handy command-line program called rsvg that does exactly what I want. I seem to have already installed it on my laptop, and confirmed that it was what I needed. I then proceeded to install it on my FreeBSD server, so I installed graphics/librsvg from the Ports system. It turns out that the build pulled in a zillion Gnome-related libraries, so the build took quite a while. It installed ... but no rsvg command. It turns out that was the old version of the library. So I thought I'd update my Ports system to the latest version, but archived a copy of the previous one to save. While I was updating, I noticed it updated a library called librsvg2, which sounded promising. So I went to install that, but it complained that some dependent library was out of date and I was a bit hesitant to just update my whole system to the latest version of everything. So I reverted back to the previous Ports system I had installed (remember that backup I cleverly made?) and tried to install librsvg2. After a couple of hours of building more Gnome dependencies (why does an SVG renderer need audio libraries? or an object request broker?) somebody said "hey, why not just use the ImageMagick convert program?" I thought ImageMagick only handled raster graphics, but it turns out I was wrong. ImageMagick happily renders SVG files into PNG in exactly the form I wanted. Augh!
Now my server (which is sort of low on disk space already) had a ton more useless crap installed that I don't need and don't really know what can be safely removed.
Anyway, on to the interesting part. Xearth for Windows has an "earthquake" feature where recent earthquakes are displayed as yellow circles on the earth image, with a size proportional to the magnitude of the earthquake. It was a fairly quick and dirty implementation because it just draws a circle on the screen without regard to the map projection at all. With the new overlay support in xearth, I thought a good way to implement earthquakes would be to render the earthquake circles onto a mostly-transparent PNG file, and then overlay that over the map image. Here's what you get:
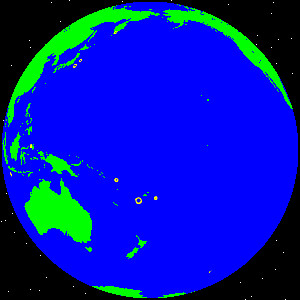
If there are any earthquakes visible (there ought to be), they will appear as yellow circles. This is done by downloading the current earthquake list (magnitude 5 or greater) from the USGS, using XSLT to transform it into SVG, then converting it to PNG for use by xearth. The earthquake list is updated once an hour.
Greg Hewgill <greg@hewgill.com>
Now my server (which is sort of low on disk space already) had a ton more useless crap installed that I don't need and don't really know what can be safely removed.
Anyway, on to the interesting part. Xearth for Windows has an "earthquake" feature where recent earthquakes are displayed as yellow circles on the earth image, with a size proportional to the magnitude of the earthquake. It was a fairly quick and dirty implementation because it just draws a circle on the screen without regard to the map projection at all. With the new overlay support in xearth, I thought a good way to implement earthquakes would be to render the earthquake circles onto a mostly-transparent PNG file, and then overlay that over the map image. Here's what you get:

If there are any earthquakes visible (there ought to be), they will appear as yellow circles. This is done by downloading the current earthquake list (magnitude 5 or greater) from the USGS, using XSLT to transform it into SVG, then converting it to PNG for use by xearth. The earthquake list is updated once an hour.